(+48) 508 425 378
 office@bitpeak.pl

Intro
Are you considering the implementation of a business intelligence tool but find it challenging to select the right one? There are multiple options available on the market, so the choice might be difficult, as not every piece of information is easily accessible or clear. Additionally small details can have a future impact on scalability, costs or ability to integrate other solutions. But you are in luck as our experts are ready to provide you with guidance and a comparison of three distinct BI systems, to help you make a more informed choice.
Power BI, created by Microsoft, is a very user-friendly business intelligence tool. It enables you to easily import data from various sources and create interactive dashboards as well as reports. Its drag-and-drop interface makes it accessible to non-technical users and allows it to work well in self-service scenarios. Additionally, this tool is also very robust when it comes to enterprise-grade solutions.
Being a part of Microsoft’s ecosystem is one of its strongest points as it seamlessly integrates with the whole suite of Microsoft products like Excel, Power Point, Teams and Azure. It is also a key component in a brand-new data platform called Microsoft Fabric!
Tableau is one of the first players when it comes to BI tooling on the market. It empowers users to explore and understand data through interactive and shareable dashboards. Tableau also supports data integration from multiple sources, offering visually appealing and complex visualizations. The ability to create very sophisticated visualizations which can reveal hidden business insights is Tableau’s most recognizable trademark.
Additionally, this tool encourages collaboration, making it suitable for teams to share insights and work on data projects. Currently owned by Salesforce, it easily integrates with this most popular CRM system on multiple levels.
Wyn Enterprise might be the least known of the three, but it has some unique approach amongst BI tooling. Let’s start by saying that it is a comprehensive business intelligence and reporting platform designed for enterprise-level data analysis and provides robust data integration capabilities, customizable reporting, and dashboarding options.
It prioritizes security and governance, making it suitable for large organizations with strict data compliance requirements. The main focus of this solution are embedding scenarios for a vast number of users. Combine it with exceptionally attractive licensing and you have a very good combo for many organizations!
Deep dive
Connecting and transforming data:
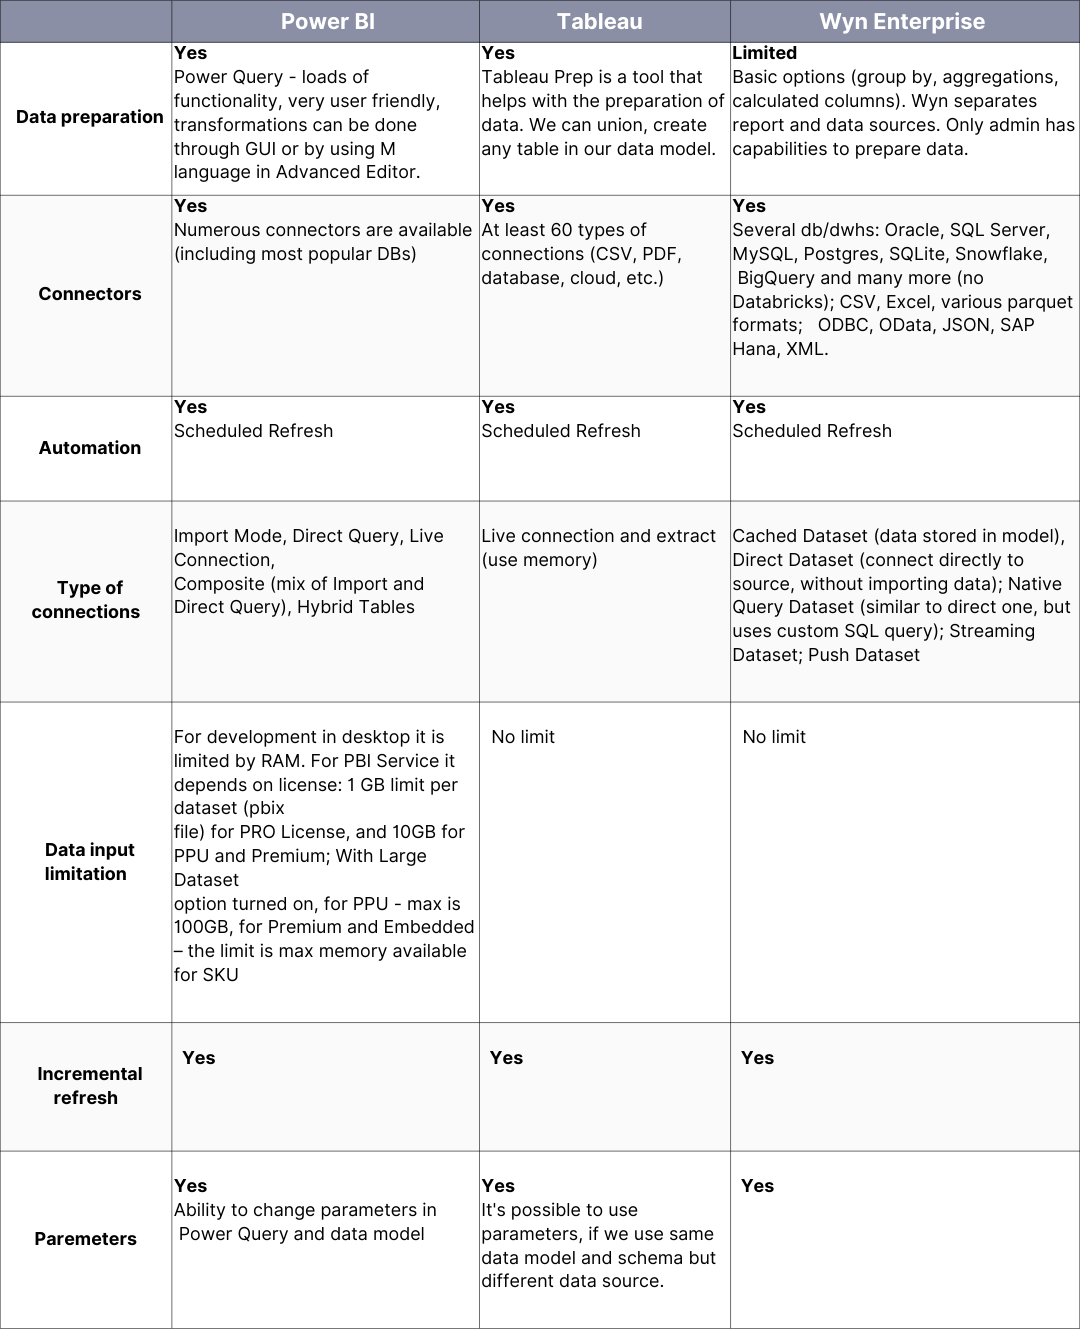
Let’s explore how the tools stack up when it comes to data preparation, connectivity, automation and scalability.
Having out-of-the-box data connectors and the ability to shape the data is crucial for smooth and effective workflow. This is especially important when working with excel or csv files. But even with database as a source, small tweaks in data are often necessary. A tool that allows the user to quickly connect to particular data sources and transform data to correct format without the need to use other tools is a blessing, increasing the efficiency and easy of use of the whole system.
Well-prepared data is the basis for proper analysis and thus for correct business information. Properly modeled and mapped data can contribute to the correct calculation of key business KPIs.
Looking at Power Bi, typically the first component users interact with is Power Query. And this is great because Power Query can be also found in Excel ( the most popular analytical tool on our planet btw.) and is well known among its users. Power Query is also praised both for its intuitive GUI and for its M language which offers great flexibility for data transformations.
On the other hand, Tableau has its own offering called Tableau Prep which is highly appreciated for its extensive use of AI in suggestions for data transformation processes. This helps the users to speed up work time and take advantage of facilities that he would not have noticed. In addition, most things can be done using a graphical interface, without any code. Wyn Enterprise provides some data preparation options, although in a more limited capacity. So preferably, it would be used with data that is already clean and transformed.
All three tools come equipped with a diverse array of data connectors, ensuring effortless integration with popular databases. They each support both scheduled and incremental refresh options, enabling users to keep their data current. Furthermore, they provide flexibility in selecting various connection types tailored to specific requirements.
A noteworthy feature shared by Tableau and Wyn Enterprise is the absence of any limits on data input size. This means your data can scale in tandem with your business growth, free from constraints. Additionally, all three tools are equipped with incremental refresh capabilities, resulting in efficient data updates and options to parametrize data sources, which greatly improves the experience of working with multiple data environments.
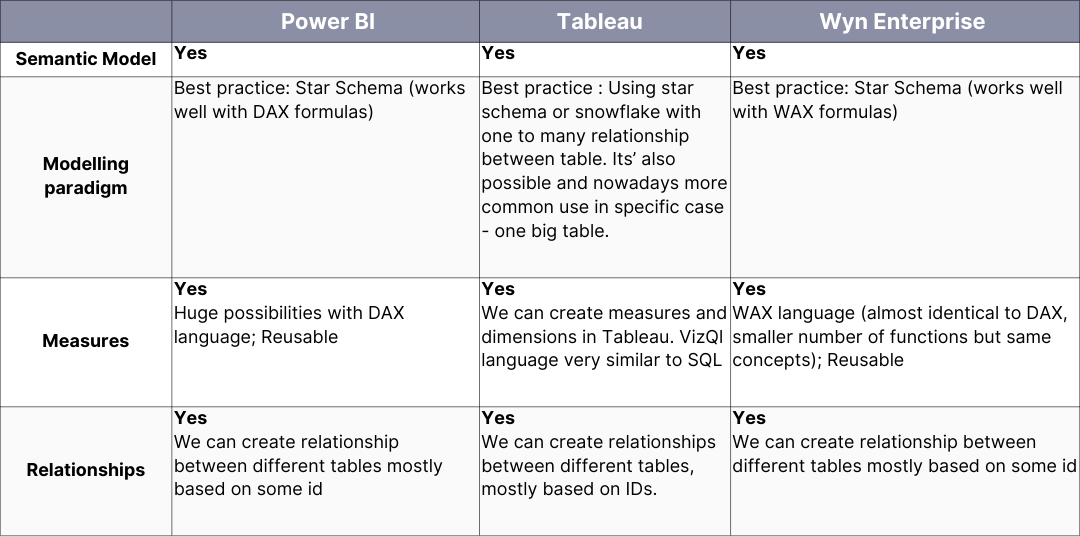
Modelling
Data modeling is one of the key things when working with data. Starting with any work, architects, bi-developers, data engineers and data modelers face the challenge of creating a model that fully meets business requirements. This can be difficult, especially with large and complex models based on different data sources. In this case, we expect that the BI tool supports developer in this task and offers the highest possible data processing performance. So, we would like to compare Tableau, Power BI and Wyn Enterprise applications in the most important aspects for us from the developer’s point of view.
All of the aforementioned software offers the possibility of modeling and creating relationships between tables. They all work best together in the context of efficiency and optimization in the structure of star schema. All of the three tools allow you to create measures prepared for specific business requirements. Power BI and Wyn have very similar analytical languages, with the same concepts such as context and context transition. Although there are some differences in the number of functions available (in favor of Power BI). Tableau offers VizQl which is really similar to SQL language which we use in database. That makes it easier for people switching from a database to BI application.
Reporting
The reporting layer is very important as it touches both report developers, who create complex dashboards based on gathered requirements, and business stakeholders who use those dashboards on a daily basis. Therefore, reporting capabilities must fulfill the needs of both groups. For developers the tool needs to be flexible, easy to use and with vast amounts of functionality.
Having those attributes results in a data product (report, dashboard) that will be used on a daily basis by the Business and will grant observability, deliver insights or just plainly make their life easier when it comes to running their company.
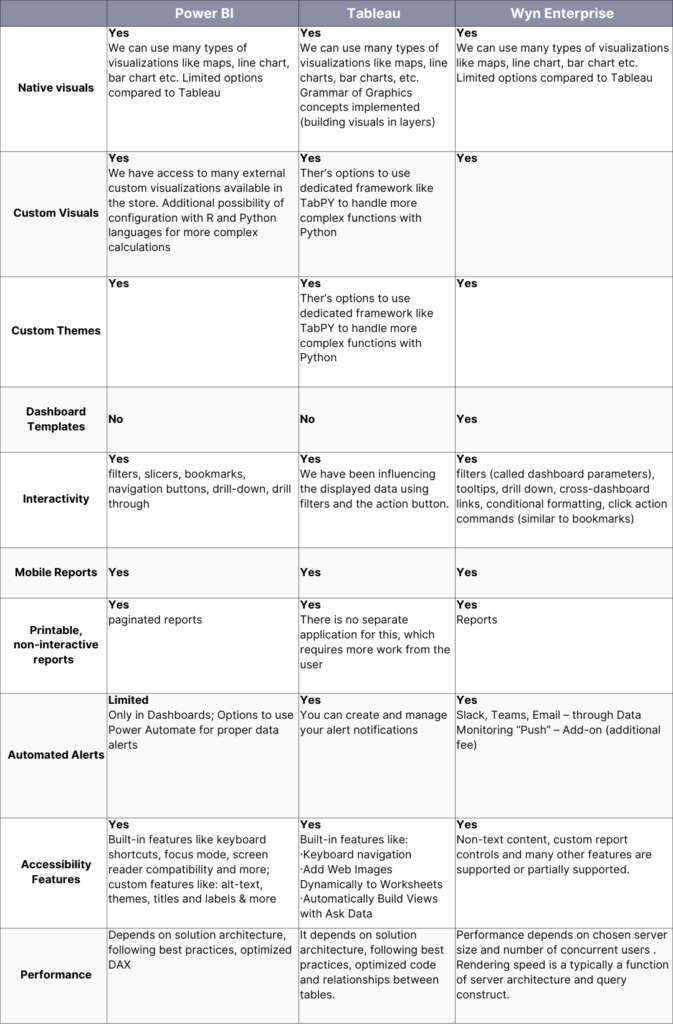
We can clearly say that in this category Tableau is ahead of the competition. It is following a grammar of graphics approach where visuals can be built layer by layer. Some things that are easily achieved in Tableau are out of reach when using Power Bi or Wyn Enterprise. Power BI is currently investing heavily in its native visuals and its reporting capabilities so we can clearly expect some great features in the coming months. It is also worth mentioning that Wyn Enterprise has more out-of-the-box visuals than Power BI at this moment.
We’ve prepared a detailed comparison of available features:
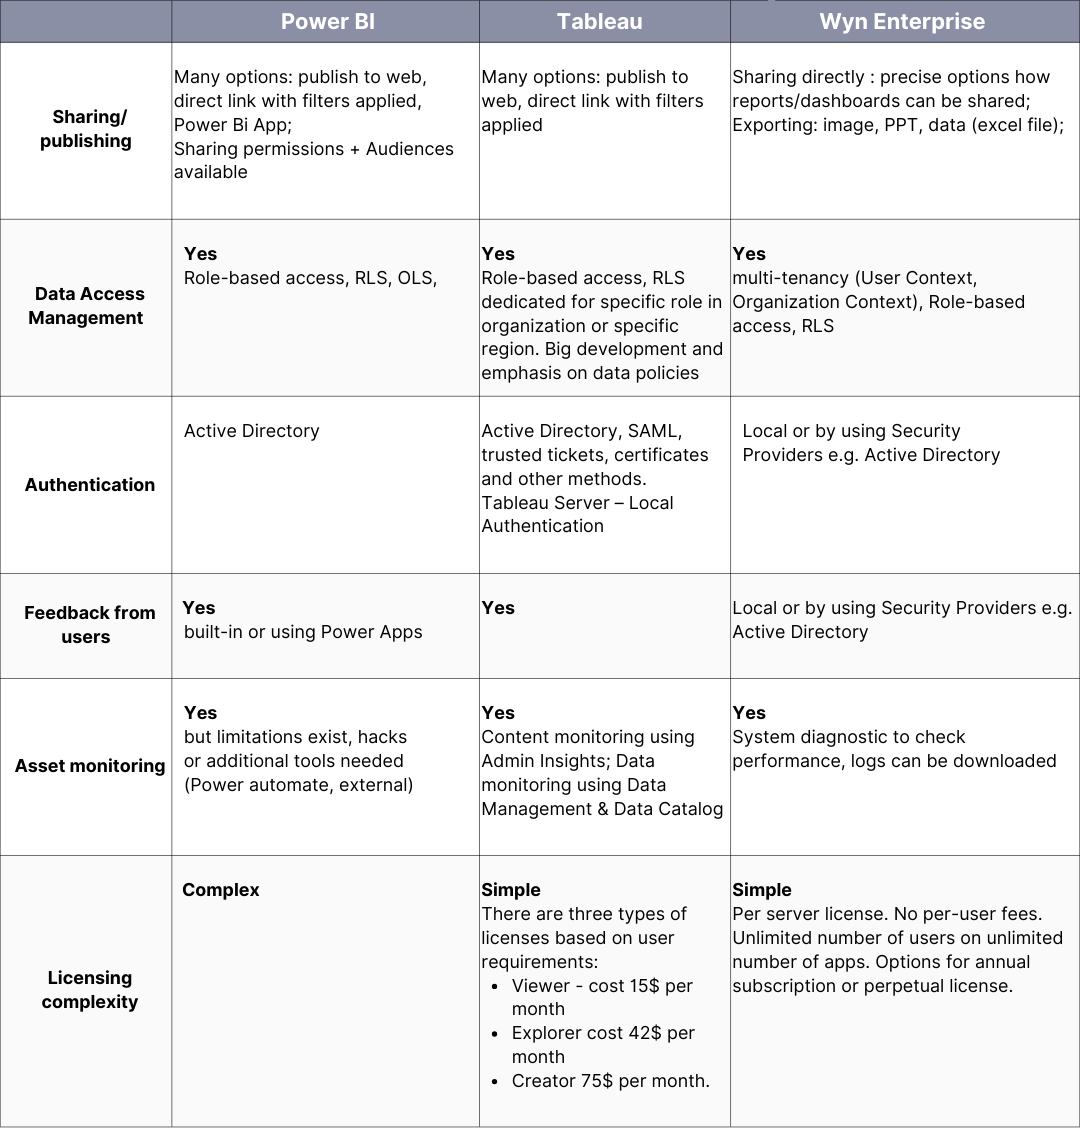
Sharing of data products / Administration
The ability to share reports, manage access and allow users to see only the relevant data is basically the main difference that distinguishes BI tools from non-BI ones, such as MS Excel. In the world of Excel, spreadsheets can be sent or shared without any restrictions. Typically, users can modify the data, perform their own detailed analysis and suddenly what happens is that we have multiple versions of the same file flying around and nobody knows which one is the right one. A true nightmare.
With BI systems like Power BI, Tableau or Wyn Enterprise it should not happen as those tools have built-in sharing functionalities, access management, security, data loss prevention and many more. Business users wouldn’t be able to modify the underlying data but will be able to perform their own analysis using available models. Perfect!
The second thing that is worth keeping an eye on is what happens with your data assets, as they are crucial to get the most out of your BI solutions. Let’s imagine a real-life situation. You worked hard to ingest all the relevant data, transformed it, modeled it by applying all the hard gathered business logic, created splendid dashboards and you think you can rest now?
Well, not really… Truth is that there might be a possibility that end-users are not using your data product as it doesn’t bring them any kind of business value. To know that it is the case and to react quickly by adjusting final solution you need to have some observability of what is going on. You would like to monitor usage rates and also get relevant feedback from end users.
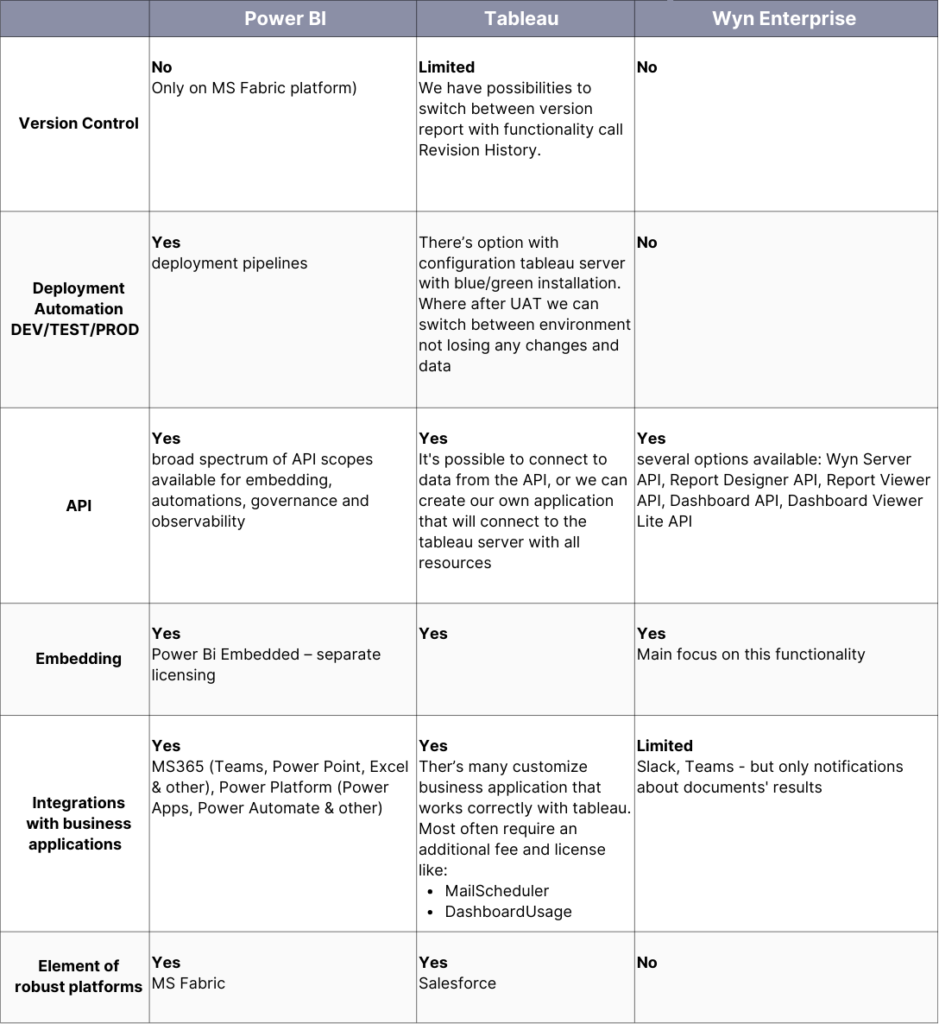
Development & Ecosystem
AI
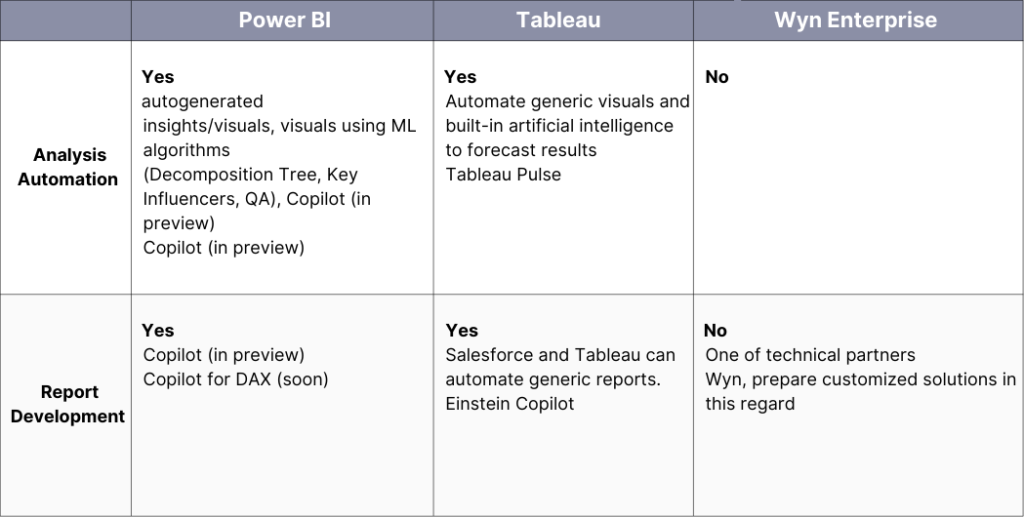
AI! The new word of the year. If you are not sleeping under a rock, then you know we couldn’t omit it in our analysis. AI-based solutions are being added to almost every tool to increase development speed and/or increase user experience. AI features can be divided into the ones that use simpler ML algorithms and the ones based on modern Large Language Models.
The first group has been available in many BI tools for several years – mainly in the form of more sophisticated charts that could reveal some hidden insights or as interface where users could ask the question about data (with really mixed results). The second group is being introduced as we speak.
It brings the promise of huge productivity boost for both report developers and business users. Available previews show that LLMs could help developers with building report elements, generating code and performing deeper analysis. Business users would be able to ask questions about data, receive report summaries or insights-based recommendations.
The changes are both rapid and promising, so it is important to watch out for new tools and implementations. But for now, let’s focus on the comparison of existing features
Both Microsoft and Salesforce are heavily investing in this domain so in Power BI we will have Copilot serving both developers and users and in Tableau we will have Einstein Copilot (for developers) and Tableau Pulse (for business users).
As you can see, each solution has its strengths. The choice is not easy and should always take into consideration needs, means and perspectives of an organizations. But with our guide (that you can always go back to!) You should be able to decide on the path that will result in highest efficiency and scalability, as well as lowest costs!
All content in this blog is created exclusively by technical experts specializing in Data Consulting, Data Insight, Data Engineering, and Data Science. Our aim is purely educational, providing valuable insights without marketing intent.