(+48) 508 425 378
 office@bitpeak.pl


Data Flow Diagrams (DFD)
In the realm of data analytics, understanding and managing the complexities of data flow can be a challenging endeavour. Enter Data Flow Diagrams (DFD) – a tool often used by experienced data professionals. DFDs serve as visual roadmaps, illustrating the journey of data from its origin, through its processing stages, and onto its eventual use or storage. By offering a transparent view into flow of data and its architecture, these diagrams allow analysts to grasp the intricacies of data processes, making them indispensable in large-scale business analytics projects. Whether you are a novice seeking clarity or a seasoned analyst aiming for optimal data management, diving into this article will offer insight into the transformative power of DFDs and why they are a cornerstone in the world of data analytics.
DFD types
Data flow diagrams can be categorized from the highest to the lowest level of abstraction, thus showing different levels of detail in data flow and transformation. Thanks to this, diagrams can be adapted to a given stakeholder and assumed objectives.
Context diagrams (Figure 1), the most general ones, present the entire data system. They indicate data sources and recipients as external entities that are connected by a transformation engine, i.e., a data processing centre between these entities.
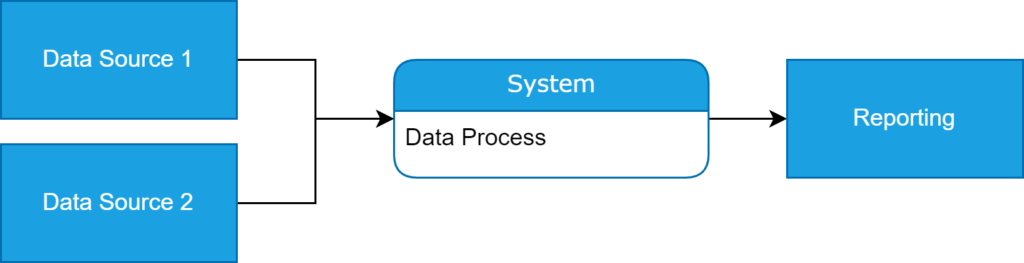
Figure 1 Exemplary Context Data Flow Diagram in BitPeak in Gane and Sarson notation
The system-related processes are illustrated by the lower level DFDs, i.e., level 1 diagrams (Figure 2). This diagram type shows more detailed information distinguishing between individual data inputs, outputs, and repositories. Therefore, they can demonstrate the structure of the system and data flows between its depicted parts.
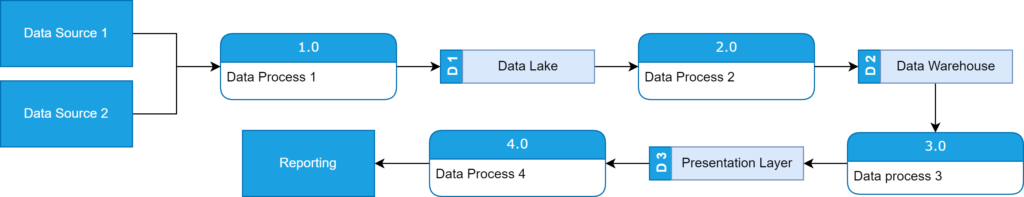
Figure 2 Exemplary Level 1 Data Flow Diagram in BitPeak in Gane and Sarson notation
Then if it is required, decomposition of each system partition can be performed. As the result, the same external entities, further data transformations, stores and flows are obtained, however at the lower level (level 2 in Figure 3, level 3 diagram, etc.) giving increasingly detailed information.
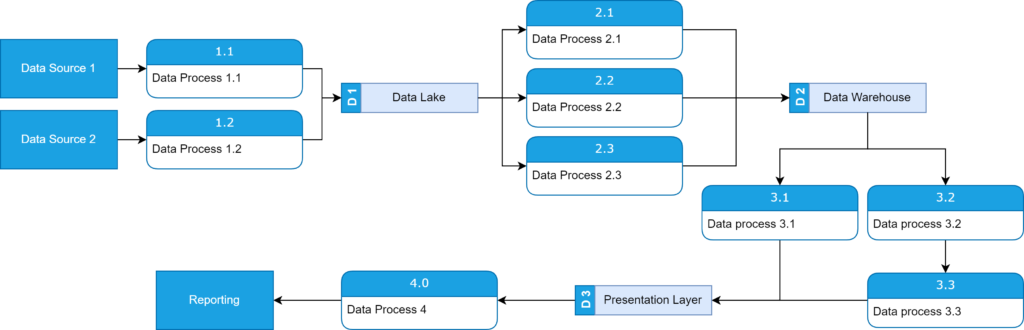
Figure 3 Exemplary Level 2 Data Flow Diagram in BitPeak in Gane and Sarson notation
Elements
In data flow diagram we can distinguish the following elements: external entities, data stores, data processes, and data flow, which are represented by different graphic symbols depending on the notation. Here we use the Gane and Sarson notation whose coding is shown in Table 1.
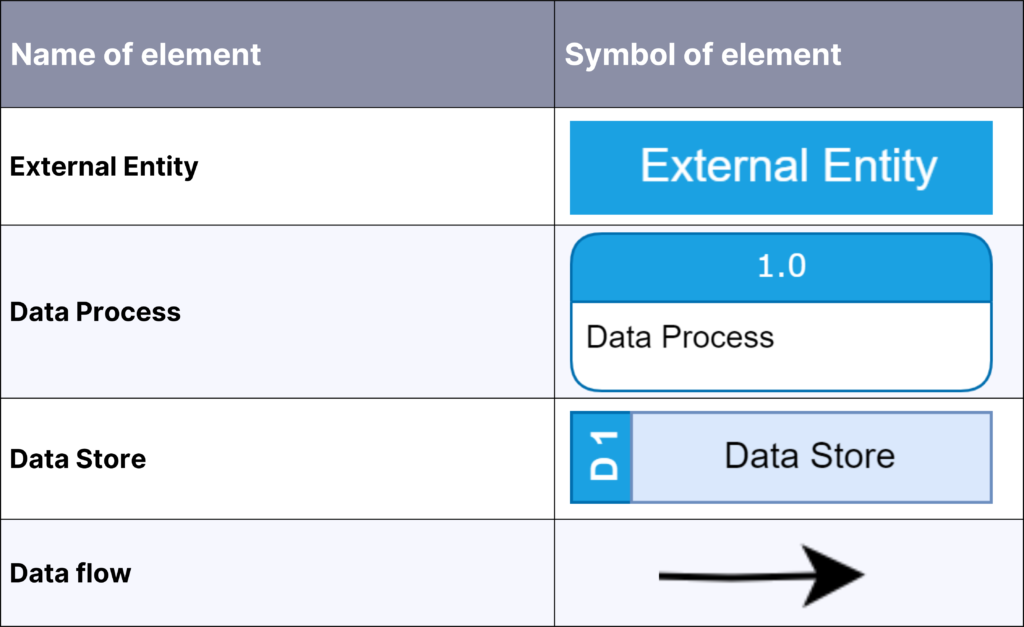
Table 1 Gane and Sarson notation
First one is tool, system, person or organization capable of generating or gathering data outside the analysed system. External entities can be where data is loaded from (data sources) and/or into (data destination). They are used at all levels of diagrams, starting from the context level and continuing downwards. An important requirement for such entities is that they indicate at least one flow of data that may enter or leave them.
The data store, the next element, is where the datasets are kept after loading and allows the data to be read multiple times. In other words, this is data at rest, waiting to be used. Data stores require at least one data flow, it can be incoming or outgoing.
Processes, on the other hand, are manual or automated activities that transform data into business-relevant results. They demand at least one incoming and one outgoing data flow.
Data flows illustrate the flux of data between the three above-mentioned elements and combine inputs and outputs of each data operation.
Experience in using DFDs
In BitPeak data flow diagrams are frequently used for portraying the data system in user friendly and understandable way for our Clients and coworkers. Such a technique makes it easier to exchange information about data model and its verification. With these diagrams, Business Analyst can clarify in an accessible and understandable way the logic and all the complexity of data flow to the Stakeholders involved ensuring alignment of business and data strategies.
We also use DFDs to determine the scope of the system and related to it elements, like user interfaces applied within, other systems and interfaces. These diagrams help in presenting relations with other systems (external entities) as well as between internal data process and stores. They can be useful for depicting boundaries of analysed system. Therefore, the required effort in project creation and valuation can be estimated. Additionally, it enables for decomposition of system at desired level to show adequate details of data flow. Deduplication of data elements and detection of their misapply can be reached with DFDs as they can easily track such objects and determine their function in the data flow. Diagrams also support the creation of documentation and the organization of knowledge about data and its flow.
However, there are few challenges with application of data flow diagrams, especially with big-scale systems. The larger the system, the more elements and relationships between them it contains. Therefore, respective diagrams are much larger and complex. This leads to rise of difficulty of understanding of DFD, and therefore data system by Stakeholders. Even with extensive experience in the data area, it is sometimes hard to grasp all the nuances of the analysed complex system with your own mind.
Another limitation is the fact that data operations alone provide small (but important) piece of information about business processes and stakeholders. Hence, a more complex analysis of the system using many techniques (e.g., business capability analysis, data mining, data modelling, functional decomposition, gap analysis, mind mapping, process analysis, risk analysis and management, SWOT analysis, workshops), including of course DFD, is required.
The next disadvantage Is not showing sequence of activities, but only depicting main data processes, so some important details are missed. However, thanks to that more general approach a clearer picture of system is received, which facilitates Stakeholders to follow the data flow from source through each data store to the final output.
Another challenge is plenty of notation methods used to create DFD as different symbols may cause confusion for the recipients of the documentation. The solution to this issue is very simple. All it takes is a conversation between the diagram creator with clients and project collaborators, specifying the requirements for the notation (in this article we have introduced Gane and Sarson notation), symbology used, level of detail, and information contained in the DFD.
Summary
Data Flow Diagrams (DFD) serve as a cornerstone in data analysis, providing a visual roadmap of data processes and flows between data entities. However, while they improve understanding and promote effective communication with stakeholders, challenges arise with system scale and varying notation methods. DFDs may not cover the full breadth of business processes, necessitating supplementary analysis techniques to avoid missing important elements. Nonetheless, their ability to simplify complex data systems and guide insightful business decisions underscores their significance in the data analytics landscape.
All content in this blog is created exclusively by technical experts specializing in Data Consulting, Data Insight, Data Engineering, and Data Science. Our aim is purely educational, providing valuable insights without marketing intent.